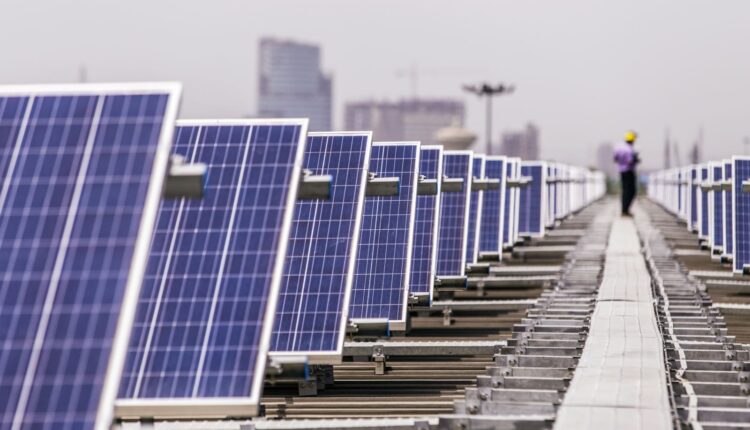
Full liked EU photovoltaic manufacturing industry : silicon wafer production capacity 1.25GW, Cells 650MW, component 6.75GW
The latest edition of the Photovoltaic Report prepared by the Fraunhofer Institute of Solar Systems (ISE) in Germany reveals the situation of EU photovoltaic manufacturing industry by the end of 2020.
EU Photovoltaic Manufacturing Industry : According to the executive summary of the latest version of the report document, the solar-grade polysilicon capacity in continental Europe at that time was 22.1 GWp. According to the report, the EU Photovoltaic Manufacturing Industry polysilicon production capacity is owned by Elkem, a Norwegian-based Chinese state-owned manufacturer, and Wacker and Silicon Products in Germany.
In contrast, according to the report of the Fraunhof Institute of Solar Systems, the production capacity of solar silicon wafers in Europe by the end of 2020 was only 1.25GW, respectively, by Norsun of Norway and Norwegian Crystals, a subsidiary of REC Silicon, and France Electric Photowatt, a subsidiary of EDF, is owned by Li Group.
The lack of battery capacity in Europe is more prominent. The study estimated that the production capacity of battery facilities is only 650MW, which is owned by the factory of Finnish photovoltaic cell manufacturer Valoe in Lithuania, the domestic facilities of Italian energy giant Enel and the Hungarian company Ecosolifer.
However, by the end of 2020, the solar component capacity in the EU Photovoltaic Manufacturing Industry market was 6.75GW, which was held by 29 companies identified in the study. The authors of the report said that this accounted for 3% of the global silicon solar component market last year, of which China contributed 67% (95% in Asia as a whole) and 2% from producers in the United States and Canada.

This study provides insight into the energy recovery period of a typical Chinese-made solar module consisting of 60 PERC batteries with an efficiency of 19.9%. Installing this solar panel in India only takes 160.6 days to generate the energy consumed in its production process, and in Canada, the number has risen to 1.42 years, or 518.3 days. In the example cited by the authors of the report, peripheral systems, non-power generation components need the longest time to replace their energy footprint, ranging from 138.7 to 167.9 days.
The statistics provided yesterday by the Fraunhof Institute for Solar Systems included the fact that photovoltaic power generation has accounted for 10.6% of Germany’s electricity generation, 5.3% of Europe’s electricity generation, and 3.2% of world power generation. Last year, the cost of rooftop photovoltaic systems in Germany was 890 to 1850 euros per kilowatt peak capacity; the current cost of flat energy provided by the country’s large power plants is 0.031-0.057 euros/kWh; and the minimum bid price for solar power remains at the registered 0 in February 2018. The price level of .0433 euros/kilowatt-hour.
Despite the significant shift in component production from Europe to Asia since 2010, Germany accounted for 7.6% of installed solar energy capacity worldwide by the end of last year, with 23% in Europe as a whole, 36% in China, 12% in North America, 9% in Japan, 6% in India, and 14% in the rest of the world, of which Including off-grid power generation.
Inverter
Referring to data provided by the British market research company IHS Markit, the report estimated the current cost of inverters: group series inverters with 64.4% market share is 0.03-0.17 euros/Wp; centralized inverters meet 33.7% market demand is 0.04 euros/ Wp; DC to DC power optimizer with a market share of 5.1% is 0.08 euros; micro inverters with a 1.4% share of the global niche market is 0.25 euros/Wp.
Looking further from many charts, the study also shows how the price of solar feed-in electricity in Germany saw a cliff-like decline when the price of household electricity began to rise steadily between 2008 and 2013, and specified how Germany moved the focus of production to the Far East in 2010, 201 Increase in solar peak power generation by about 7-8 GWp in 1 and 2012. But since 2017, Germany’s installed capacity has grown steadily at a rate of about 1 GW a year, which is encouraging for EU Photovoltaic Manufacturing Industry manufacturers.

